A definitive guide for performance improvement tools and solutions for web applications
Generally, you get downgraded performance from a web application due to the following reasons, assuming your web server is fast and located near the user's location to reduce network delay.:
- Large scripting files
- Large and unnecessary CSS/Styling
- Large resources loading like images, icons, videos
- Too much time taken by APIs/Services to respond
- Memory leaks while writing the javascript applications
Identify the current performance of a web application
Using Webpagetest
It helps run the test for different browsers, environments, and locations. It can help you to understand how your application is performing on specific browsers and sites. It gives you different grades based on six criteria:
- First Byte Time
- Keep-alive enabled
- Compress transfer
- Compress images
- Cache static contents
- Effective use of CDN
Using Lighthouse
Add this as a chrome extension, or you can visit the website https://web.dev/measure. You can run an audit for your website and see generated report. This report contains four parts:
- Performance
- Accessibility
- Best Practices
- SEO We will only go into details of the Performance section.
Understand performance reports
Webpagetest Report
First Byte Time:
Represents the time taken for your application to respond based on the location of the browser environment.
In the below example, you see it took half of the time for an SSL connection, resulting in 429 milliseconds
(> 0.4 secs) in the first request — quicker the response, faster the web page performance.
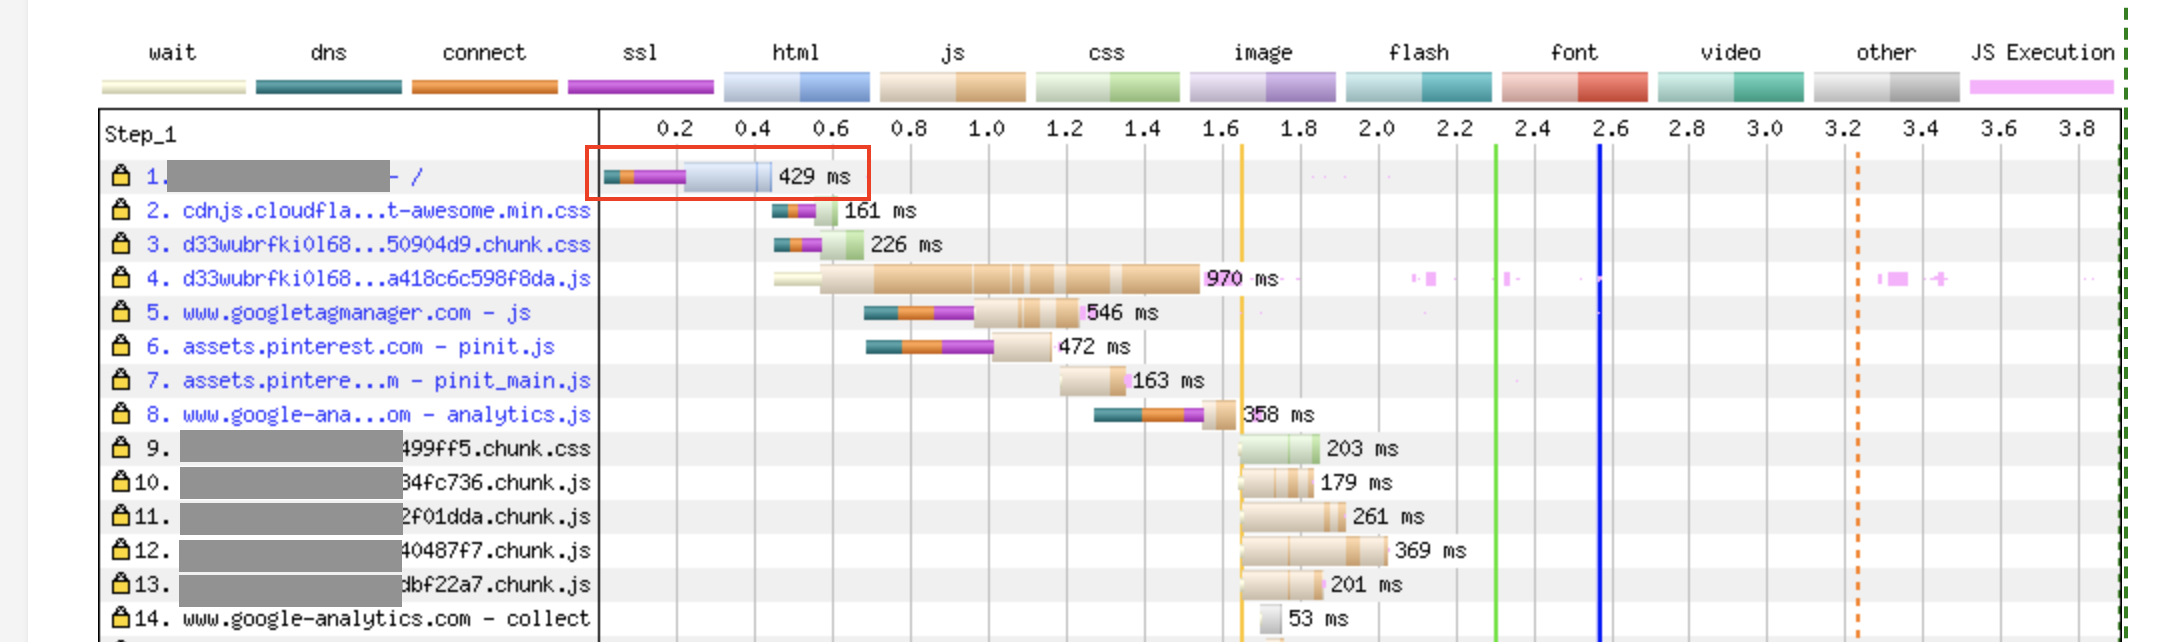
Keep-alive enabled:
Allow the transfer of multiple files over a single connection; without it, every new resource requires a new
network connection from the browser to the server. As shown in the above example, it takes time to open a new link.
Compress transfer:
It tells information about compressed and non-compressed resources, including javascript, styles, fonts, and
other resources, while serving and gives indicative size saved in-network transfer. Compression reduces the
overall size of the contents.
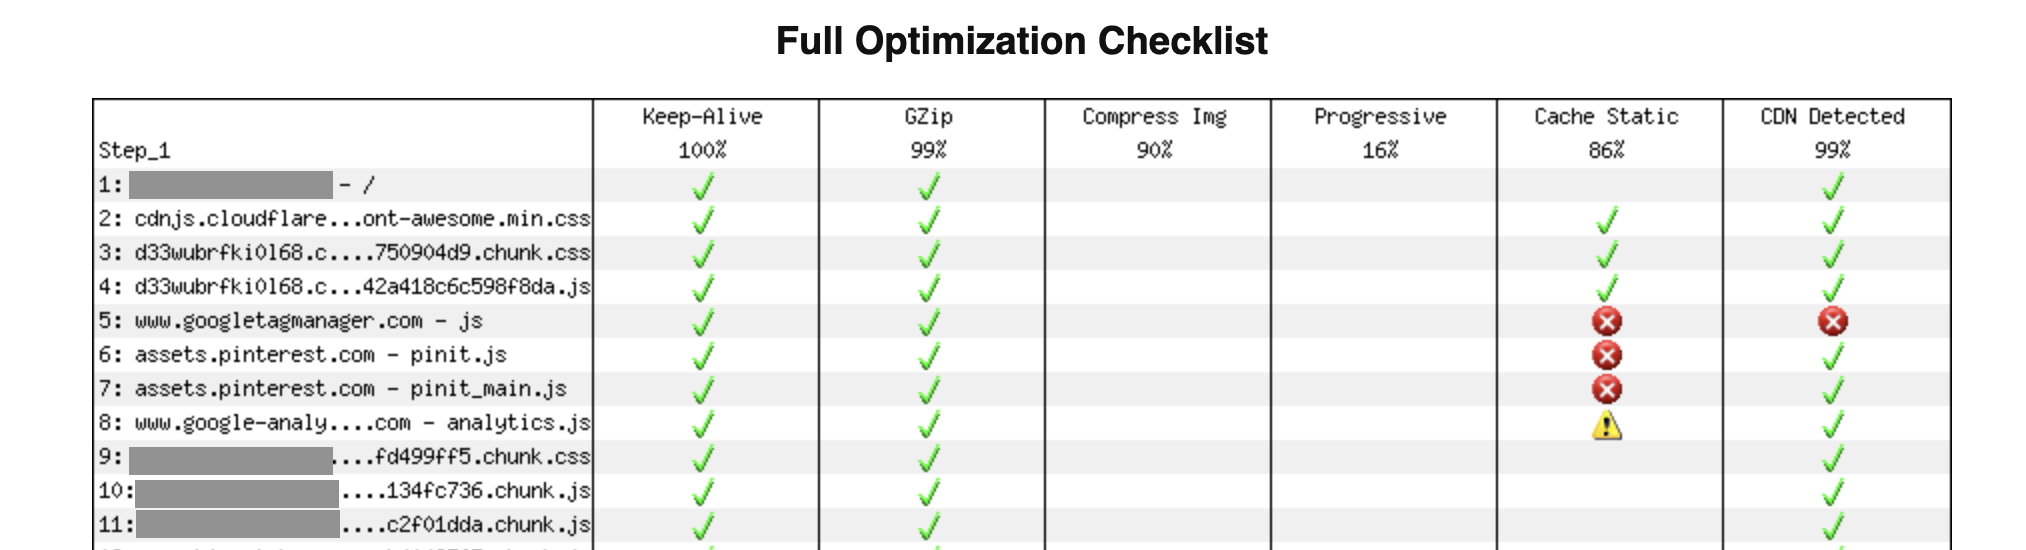
Compress images:
It tells information about compressed and non-compressed images. It helps to understand uncompressed images
to optimize the UI performance.
Cache static contents:
It tells information about caching of resources/contents. Every static resource should have caching strategy
associated with reducing the overall round trip from browser to a server.
Effective use of CDN:
It tells resources served from CDN (Content Delivery Network). For CDN details refer
here.
Lighthouse Report
Performance scoring has six criteria having different weights; you can refer to the scoring details here
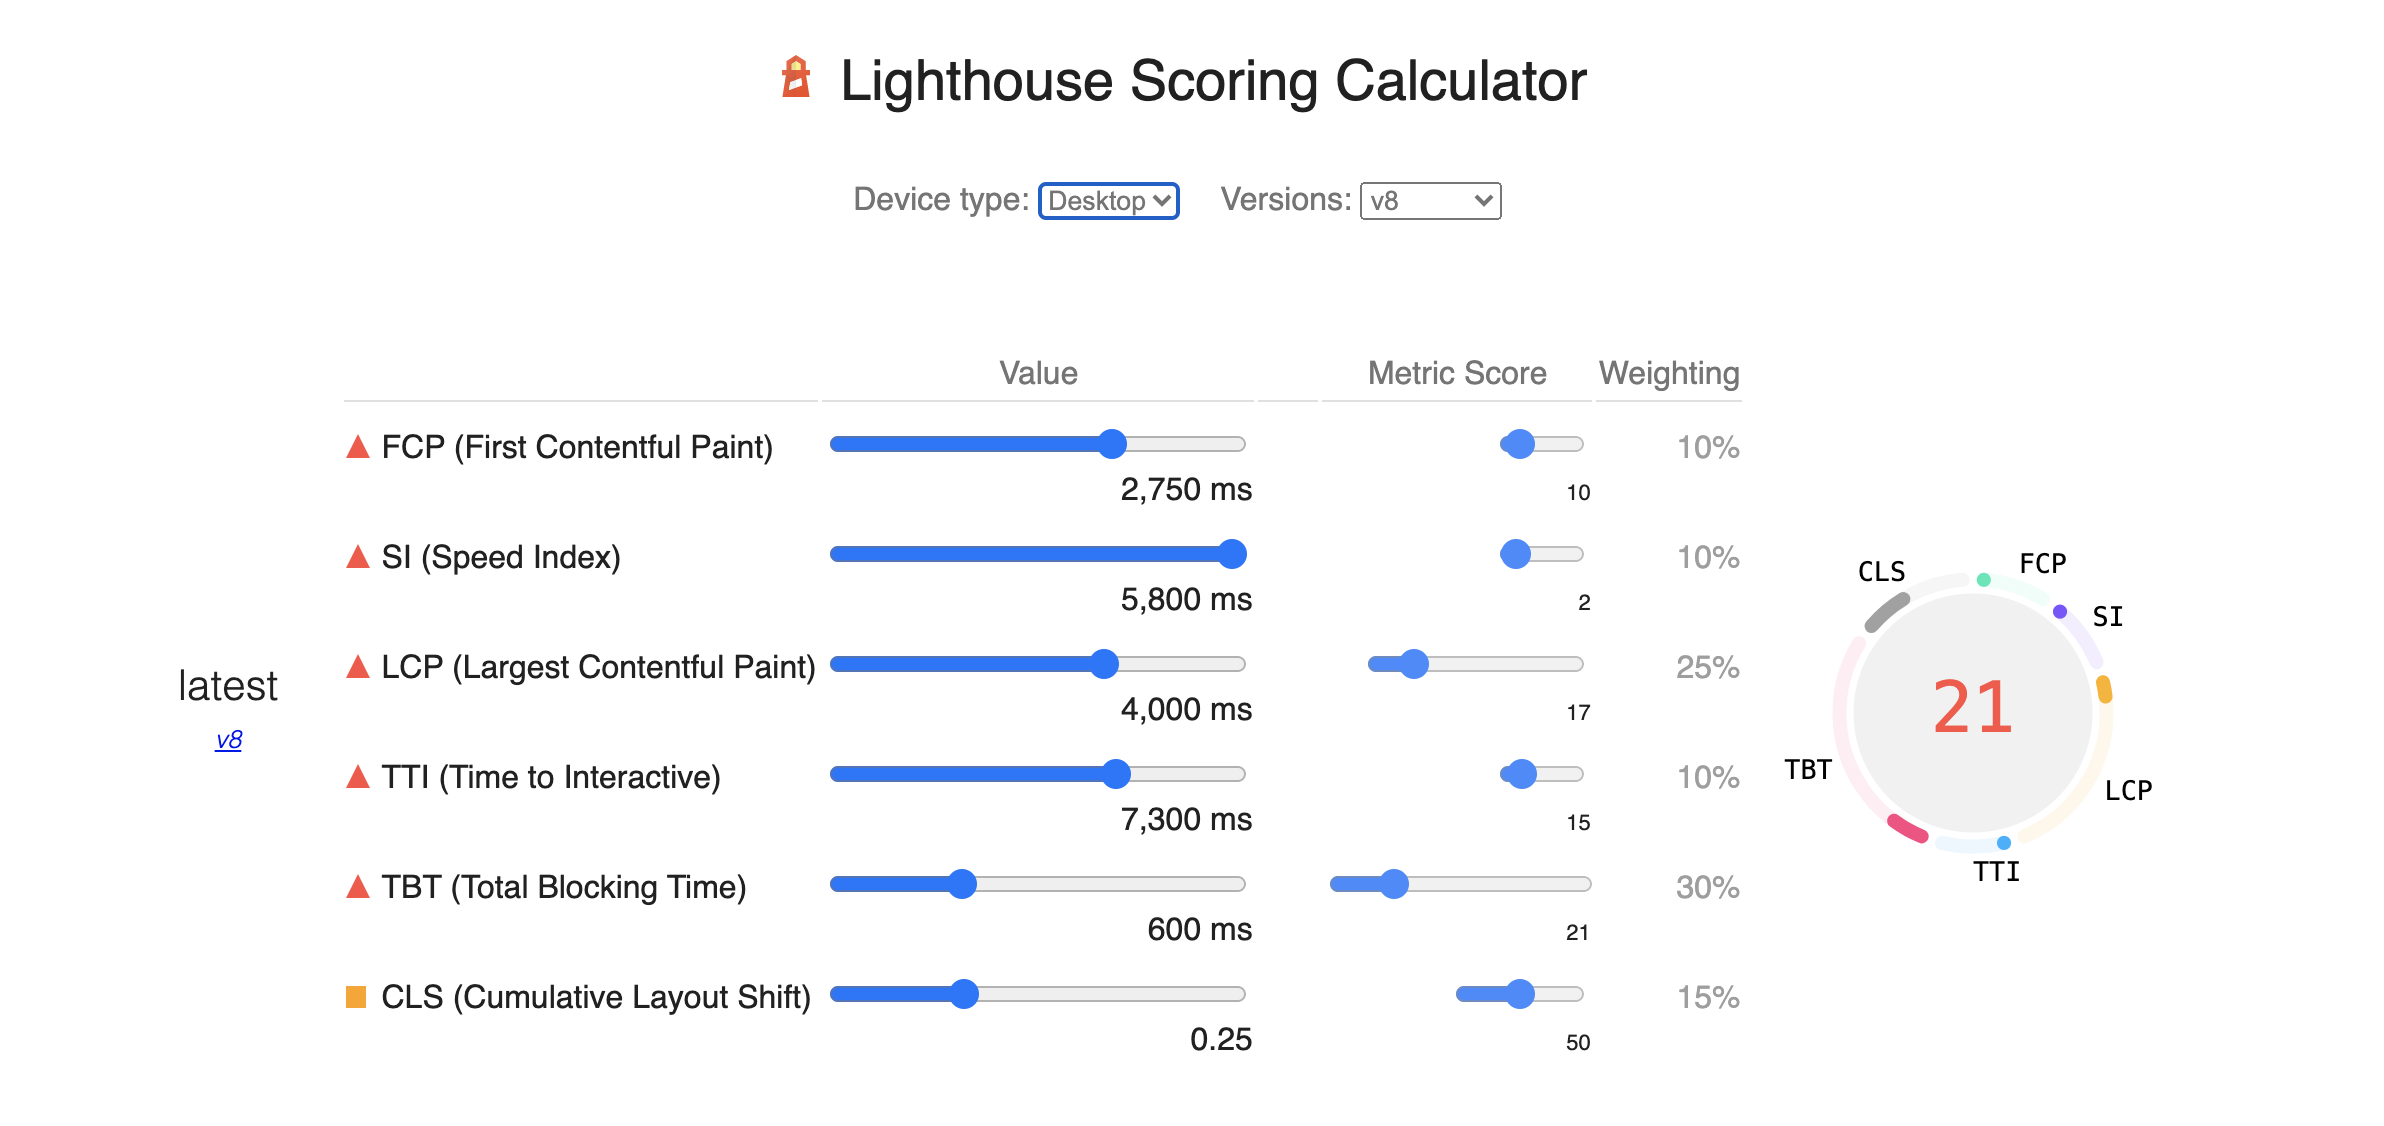
First contentful paint:
It is how long it takes the browser to render the first piece of DOM content after a user navigates to your page.
If it takes more time to paint the initial contents, check if your application blocks the critical rendering path.
Largest contentful paint:
The Largest Contentful Paint metric reports the render time of the largest image or text block visible within the
viewport relative to when the page first started loading.
Speed Index:
The Speed Index metric reports the render time of the content during page load. It is represented in milliseconds
and dependent on the size of the viewport.
| Speed Index (in seconds) | Performance |
|---|---|
| 0-3.4 | fast |
| 3.4-5.8 | moderate |
| Over 5.8 | slow |
Total blocking time:
Total blocking time measures the total amount of time that a page is blocked from responding to user input, such as
mouse clicks, screen taps, or keyboard presses. The sum is calculated by adding the blocking portion of all long tasks
between First Contentful Paint and Time to Interactive. Any task that executes for more than 50 ms is a lengthy task.
Time to interactive:
It is how long it takes a page to become fully interactive.
A page is considered fully interactive when:
- The page displays useful content, measured by the First Contentful Paint.
- Event handlers are registered for most visible page elements.
| Time to interactive (in seconds) | Performance |
|---|---|
| 0-3.8 | Fast |
| 3.9-7.3 | Moderate |
| Over 7.3 | Slow |
Max potential first input delay:
It is the time from when a user first interacts with your site (i.e., when they click a link, tap on a button, or use
a custom, JavaScript-powered control) to the time when the browser can respond to that interaction.
| First input delay (in milliseconds) | Performance |
|---|---|
| 0-100 | Good |
| 100-300 | Average |
| Over 300 | Poor |
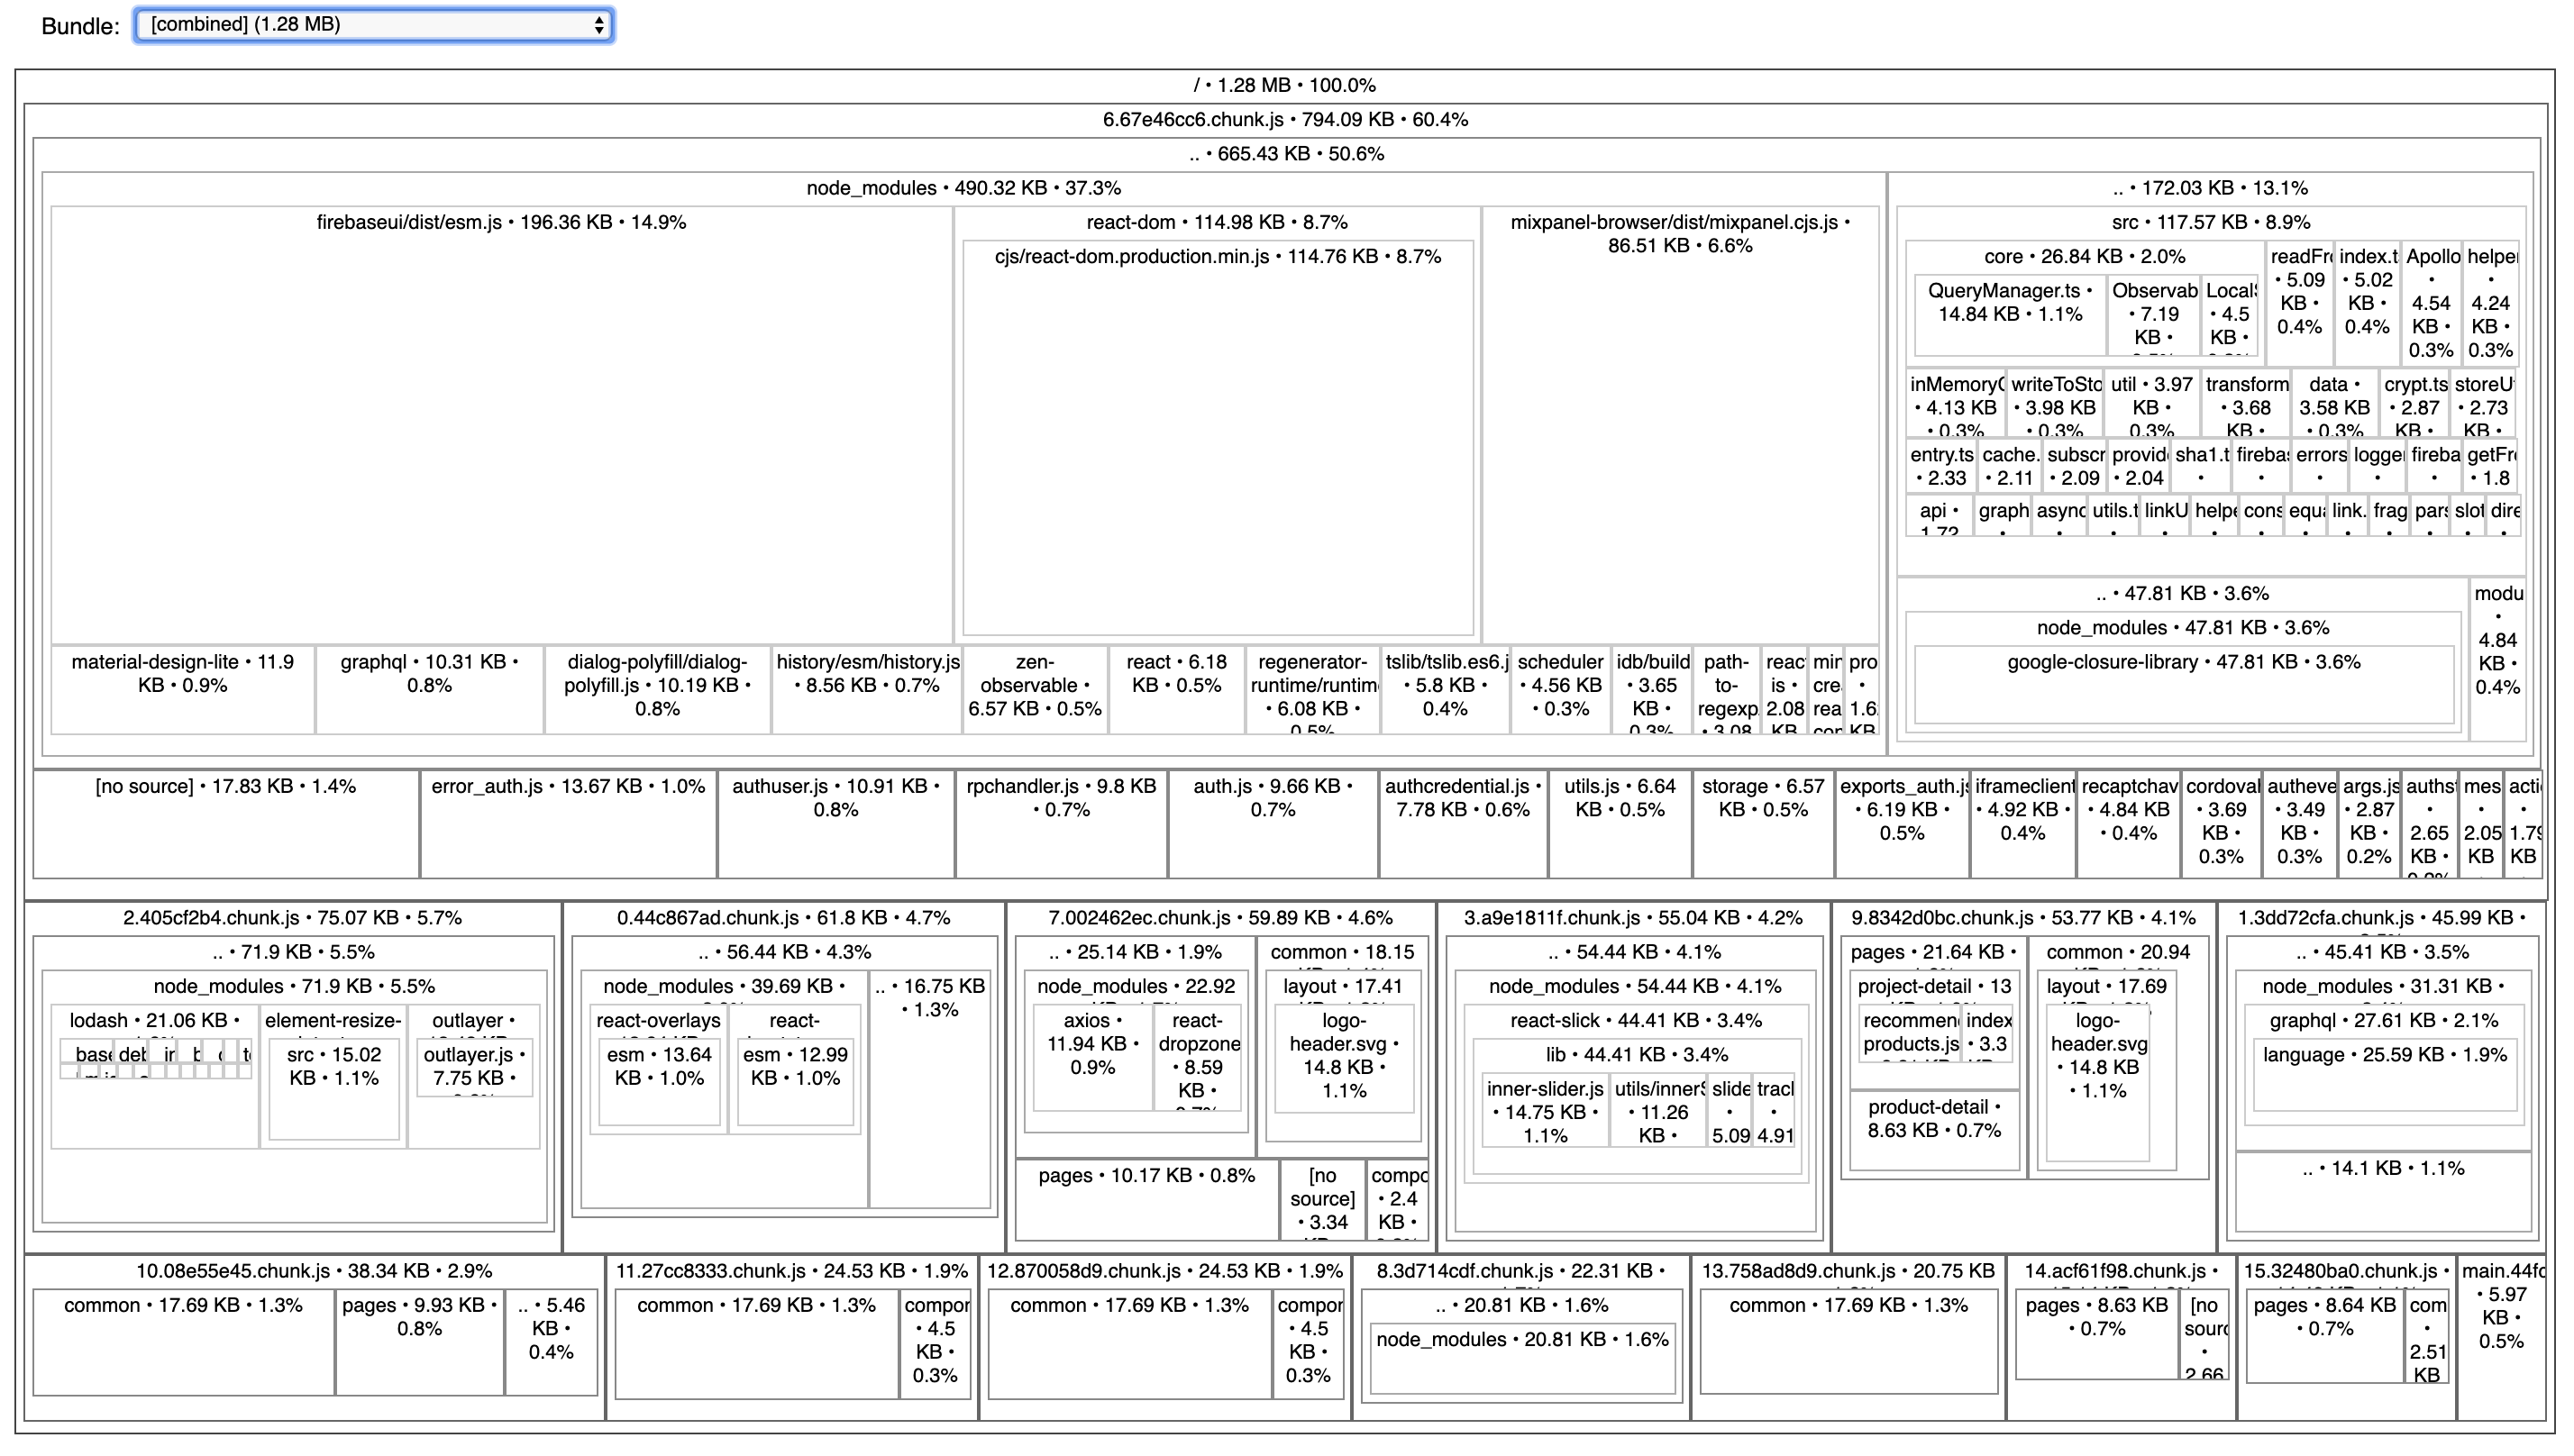
Javascript bundle size impact on performance
Running large javascript files degrade web application performance drastically. Check this article to understand the impact in detail. You can use the below tools to understand the existing bundle size of your application:
- source-map-explorer
- bundlesize
- If you are using webpack you can use webpack-bundle-analyzer.
Below is an example of bundle sizes per module.
Solutions to improve performance
We can categorize solutions into two parts,
1. Improvement with no or minimal source code change
These changes only reduce the size of payload transferred through the network, reducing network latency and the actual size of resources like images and videos.
Implement HTTP/2 protocol
- Using Reverse proxy
- Using ExpressJs refer Http/2 implementation here
- Using Java Spring boot refer Http/2 configuration here
Apply resource compression
- Using Reverse proxy
- Using ExpressJs refer Http/2 implementation here
- Using Java Spring boot refer Http/2 configuration here
Image compression and resize
Refer this guide to understand the image compression. You are also use below tools if you are using Javascript, NodeJs:
Static file caching / Service Worker / PWA
Enable static file caching on browsers like javascript, styles, images, videos, font, JSON using Google
Workbox.
CDN
Use Content Delivery Networks to deliver your static content faster. There are multiple services available; some of them are below:
Pre-loading / pre-fetching
Preload resources: you have high confidence to be used on the current page.
Prefetch resources: likely to be used for future navigations across multiple navigation boundaries.
Refer this article for more details.
Tree shaking
It reduces the javascript payload by only including the code which is necessary for the execution. Refer to this to know more about it.
If you are using webpack, then tree shaking comes inbuilt. Read in details to this
2. Improvement with the source code change.
Code-splitting:
To understand code-splitting concept refer this article.
For React, refer this article for detail.
Identifying memory leaks and fixing them (reducing overall memory usage)
Look at this and this
videos to understand and debug memory leaks in Javascript.
Refer to node-clinic npm package to understand the current memory
leak in your web application and fix them.
Reduce load from the main thread
This article gives you a good understanding and tools to achieve it.
If you have a high CPU usage code, try to move it to a web worker; you can use comlink
package for same.
Virtualize large lists
If you have large lists to display on a page, then virtualize them. Here
is a great article to explain it in detail. There are multiple libraries present few of them are listed below:
For React use: react-window or react-virtualized
For Vue use: vue-virtual-scroll-list
For Angular use: @angular/cdk
Lazy loading resources
To improve initial loading time, load resources like photos and videos late in the page load cycle. The below articles will
help you to understand how to do it.
- Browser level image lazy loading
- Lazy loading non-critical resources
- Lazy loading by Addy Osmani
- Load responsive resources
Make performance assessment as part of your DevOps
You can use the below tools to monitor your application Javascript payload size and performance
- For webpack implementation, run bundle-analyzer or Webpack CLI as part of your build process to monitor bundle size.
- You can implement Lighthouse CI like infrastructure to run performance benchmarking as part of your DevOps process.
Would you please give feedback and share additional resources with me? I will keep updating this guide.